Posts

Finding your Public Amenities in Northern Ireland
Image
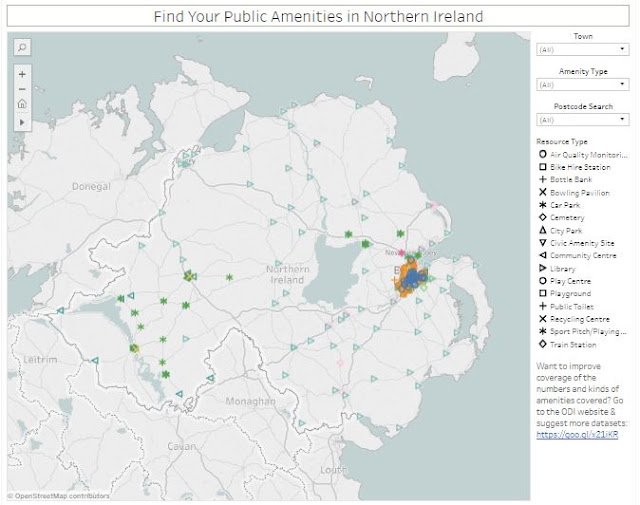
Screenshot of the Tableau Dashboard. Available [ here ] and at the end of this post. I was recently thinking back to last year’s ODI Belfast unConference where someone mentioned one of the smallest (and, by implication, the least useful) datasets available on their website [ here ] – the  list of 22 Bowling Pavilions in Belfast City. The question was ‘what can you possibly do with a list of 22 bowling pavilions?’ I seem to remember the suggestion that they might be useful in the event of a Zombie Apocalypse where they could be put to use as holding centres for the contaminated. I’m not a huge fan of the Zombie genre, but even I know that this approach will not end well. So … what do you do with a list of 22 Bowling Pavilions? This is a question that has been ticking away in the back of my head for a while now (wow … I really don’t have the richest internal life, do I?) … how do you use this kind of data in a useful way? Sure … I can build you a dashboard that shows all of...

European Testate Amoeba dataset: an interactive visualisation

Image
Screenshot of the Tableau Dashboard. Available [here] and at the end of this post. I’ve recently been working with Dr Graeme Swindles (University of Leeds) and Dr Matt Amesbury (University of Exeter) on producing an interactive visualisation based on their European Testate Amoeba dataset.  Testate amoebae are microscopic, unicellular shelled protozoa that are abundant in a range of wetlands, including peatlands. Study of fossil testate amoebae allows for the reconstruction of ancient hydrological variability. Amesbury and Swindles were the lead authors of a group that published Development of a new pan-European testate amoeba transfer function for reconstructing peatland palaeohydrology in Quaternary Science Reviews (Volume 152, 15 November 2016) [ https://goo.gl/15n4QW ]. They placed their dataset in the public domain under a Creative Commons licence, allowing others access to reanalyse and re-examine their data, and incorporate it into future research. The dataset is...

Notifiable Infectious Diseases Reports (NoIDs) Northern Ireland | Trends & Predictions

Image
Screenshot of the Tableau Dashboard. Available  [here]  and at the end of this post. (Updated: see notes at end) The OpenDataNI website holds Notifiable Infectious Diseases Reports , provided by the Public Health Agency . The available data runs from Week 50 2014 to (at the time of writing) Week 50 2016. It is a relatively simple dataset, reported weekly, giving the numbers of occurrences of some 35 Reportable Diseases in Northern Ireland. The individual reports are based on figures recorded by the Duty Room and Surveillance. The reports also indicate that: “Food poisoning notifications include those formally notified by clinicians and reports of Salmonella, Campylobacter, Cryptosporidium, Giardia, Listeria and E Coli O 157 informally ascertained from laboratories.” What I wanted to do with this dataset was examine a few different ways that the selection of timescales can result in different understanding of the data and how it can be used to examine trends an...

Follow the money! A Visual Analysis of the Community Hall Grant Scheme, NI

Image
Screenshot of the Tableau Dashboard. Available [here] and at the end of this post. Background In October 2016 Paul Givan (DUP), in his capacity as Communities Minister, launched a grant scheme to benefit both urban and rural community halls. Also at the launch was his party leader, Arlene Foster, who noted that: “Community Halls bring immeasurable benefits to the local community and this £500,000 funding will support groups across Northern Ireland to let them concentrate on enjoying the activities our community halls are designed for.” This all sounds lovely! Community Halls getting funding! Investing in local communities … seriously, what’s not to like? What could possibly go wrong? By the way … did I mention that the scheme was allocated all of £500,000? Keep that figure in mind! Fast forward to January 2017 – a mere three months later! And ‘what went wrong’ largely depends on who one asks. According to the DUP those nasty folks in SF and SDLP have gone and upset...

The inevitable first post explaining the choice of name …

Image
Hello & welcome to my data visualisation blog demonCoreData . It has been almost five years since I left* professional archaeology. Over that time I attempted to carve out a new career in IT and, over the past couple of years in particular, in the field of data visualisation. I still retain my passion for archaeology, but I currently work as a Tableau developer for a large IT company here in Belfast. Outside of work, I use the skills I’ve gained in Tableau to produce visualisations of various datasets that interest and intrigue me. Some visualisations I do as a means of expanding my skillset; some I do to think through work-based challenges using non-sensitive data that can be freely shared with colleagues and subject matter experts; and some I just do for the sheer joy of seeing raw data turn into images and jump around the screen! Rather than post the visualisations I create solely to my Tableau Public page, I’ve been thinking that it would be nice to have a place where...