Follow the money! A Visual Analysis of the Community Hall Grant Scheme, NI
 |
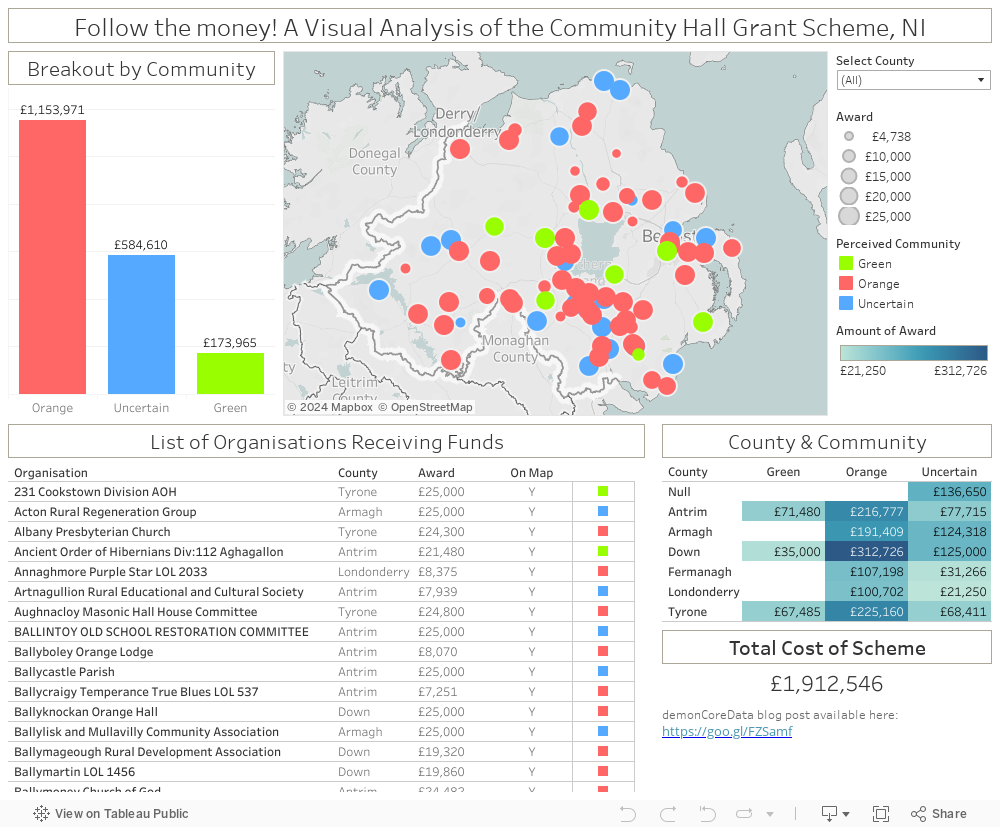
| Screenshot of the Tableau Dashboard. Available [here] and at the end of this post. |
Background
In October 2016 Paul
Givan (DUP), in his capacity as Communities Minister, launched a grant scheme
to benefit both urban and rural community halls. Also at the launch was his
party leader, Arlene Foster, who noted that: “Community Halls bring
immeasurable benefits to the local community and this £500,000 funding will
support groups across Northern Ireland to let them concentrate on enjoying the
activities our community halls are designed for.”
This all sounds lovely!
Community Halls getting funding! Investing in local communities … seriously,
what’s not to like? What could possibly go wrong? By the way … did I mention
that the scheme was allocated all of £500,000? Keep that figure in mind!
Fast forward to January
2017 – a mere three months later! And ‘what went wrong’ largely depends on who
one asks. According to the DUP those nasty folks in SF and SDLP have gone and
upset the applecart by claiming that there was something untoward in how Givan
and his department allocated the monies. Colm Eastwood of the SDLP claimed that
the terms of reference of the scheme ensured that GAA clubs could not apply for
funding. Eastwood claimed that “We were worried that the minister was trying to
look after one community, rather than the whole community.” … which is code for
‘Themuns are getting more than Usuns’. Givan, of course, denied all this and
the Department wheeled out a spokesperson to state that “A robust, transparent
and accountable assessment process was followed, with all applications being
scored against the stated criteria.” Considering that Givan had previously cut
funding to an Irish language scheme, only to find it again once the political
heat got turned up, you can rather see why the Shinners mightn’t trust him on
this. Oh … remember the £500k? … it had nearly quadrupled to £1.9m … in THREE
months!
Political Notice
I think that at this
stage it’s important to state that my stance on SF and the DUP is of the “A
plague o' both your houses!” variety. I’m not looking for a green or orange
stick to beat either of them with … but I am interested in data and how that
data can be used to examine their claims of impartiality and discrimination.
And on January 17th data is just what we got … not an awful lot, but enough!
The data we got
The data made available
by the Department for Communities was a single excel spreadsheet that listed
the names of the 90 organisations that were successful in securing funding
under the scheme and the amounts they got. Not an awful lot of data … but, as I
said, enough to work with.
What I’ve done with the
data
I really do love
Google! I’ve gone through the list of 90 organisations and with a bit of
searching, perseverance, and (occasionally) luck, I’ve been able to get at least
general locations (to the nearest town or Townland) for all but six of the
organisations. In the majority of these cases, the names are too generic to be
able to distinguish which one is the actual group that secured funding. For
example, Saint Elizabeths Ladies Guild,
St Colman's Hall, and Saint Matthews Parish Church could all
refer to more than one organisation. These six organisations together received
£136,650 – not an insubstantial amount! Once I had recorded Latitude and
Longitude for each organisation, I noted the county in which it lay, to allow a
lower level of spatial grouping for analysis.
Next, I tried to assign
a Perceived Community to each organisation. This is, admittedly, quite
speculative in places and may be rather contentious. However, there aren’t too
many devoutly Catholic Loyal Orange Lodges, so they’re easily defined as
‘Orange’. By the same logic, there are unlikely to be all that many lodges of
the Ancient Order of Hibernians drinking the health of Her Britannic Majesty,
so they were immediately designated as ‘Green’. Similarly, GAA clubs are
‘Green’ while the assorted Presbyterian, Baptist, and Church of Ireland
organisations are all ‘Orange’. Some of my other choices are quite subjective.
For example, one Community Group has been designated as ‘Orange’ owing to its’
Facebook page having a photograph of a Union flag with the ‘Red Hand of
Ulster’, while another was identified as ‘Green’ on the basis of its own
Facebook page making prominent use of the Irish language and ‘Celtic’ imagery.
Rather than unambiguously describe any organisation as ‘non-sectarian’ or
‘cross community’, I’ve hedged my bets and gone for ‘Uncertain’. As I say, this
is a bit quick-and-dirty and I want to clearly call out the subjective nature
of the decisions here and the room of improvement. Finally, I’ve also
introduced a flag (Y/N) to note whether the organisation had coordinates and
will be displayed on the map.
The Visualisation
At the centre, top,
there is a map with a dot for every organisation awarded funds. The dots are
sized by the amount awarded and coloured by the perceived community. Some
viewers may find my colour choice slightly garish. However, I am quite colour-blind and have difficulties distinguishing many shades of orange and green (seriously! .. in Norn Iron!), so I’m
making no apology for it! To the left of this is a simple bar chart, summing up
the amount awarded, broken out by perceived community. On the bottom row, left,
the data is presented in a scrolling table that gives the organisation’s name,
their county, the amount awarded, and whether they’re plotted on the map. The
colour square on each line again identifies them by perceived community. To the right
of this is a heat map, breaking out awarded amounts by the county and the
perceived community. Here, darker shades indicate larger amounts and lighter shades
show the smaller awards. In the bottom right-hand corner the total cost of the
scheme is noted.
From this we can see
that the whole scheme cost £1,912,546, with awards ranging from £4,738 (1
organisation) to the maximum of £25,000 (39 organisations). We can also observe
that a disproportionate amount (£1,153,971) was spent on organisations that may
be perceived as Orange over ones that may be reasonably seen as Green (£173,965).
The balance (£584,610) was spent on groups I have designated as of ‘Uncertain’
affiliation. By far, county Down received most cash (£472,726), of which the
majority was spent on ‘Orange’ organisations (£313k vs 35k).
However, the Tableau
Visualisation is fully interactive and clicking on one dot, bar, line or cell
will refilter the other graphs and images to those choices. The County filter
allows the user to narrow down the search to one or more counties of their
choice.
I’m not a member of
either the Orange Order or the GAA, and I’m somewhat ambivalent about giving
funding to divisive organisations, but I do see that both play important roles
within their communities. For this reason, I agree that funding repairs and improvements
to these halls is largely a good thing. However, if such funding is to be made available,
it must be administered in such a way as to benefit the people of Northern
Ireland evenly and fairly. From the available data, it is clear that this is
not the case. Hiding behind statements that “A robust, transparent and
accountable assessment process was followed, with all applications being scored
against the stated criteria.” only underscores the feeling that this was a
crooked game from the start that was cynically designed to benefit one
community above the other. Minister Givan has hit back that criticism of him in
this regard is “narrow-minded sectarianism” and that he took no personal part
in the selection process (a tactic reminiscent of his leader’s cries of ‘misogyny’
and that she wasn’t directly responsible for the RHI scheme). As much as it
pains me to seem to be in agreement with Alex Maskey’s assessment that “I would
defy anyone looking at the list to say that it doesn't look like a register of
the Orange Order” … (though overstated) he does have a point. Either Minister
Givan has cynically manipulated the scheme for the benefit of his core
community of DUP voters or he is so stunningly incompetent that he was
incapable of noticing the disparity. Either way, he has no place in government.
Conclusion
The politicians and
assorted pundits can talk all they like about how the process appeared flawed and
slated towards one community over the other, but with the data we can clearly
see how true this was. Feel free to use the visualisation to drill into the
data and make discoveries of your own. Also, please remember that we’ve got
elections coming up on March 2nd, so go register to vote here.
If you want to help end this pork barrel spending and general incompetence in
Stormont don’t vote for the DUP … probably don’t vote for Sinn Fein either …
Suggested Reading
Cost
of 'community hall' fund launched by Paul Givan quadruplesIf there are issues with this embedded version, try the dashboard on my Tableau Public page [here], or click the 'Full Screen' option at the base of the dashboard.

Comments
Post a Comment