Posts

Showing posts with the label Northern Ireland

Emergency Care Waiting Times in Northern Ireland 2008-2017 and forecasting the future
Image
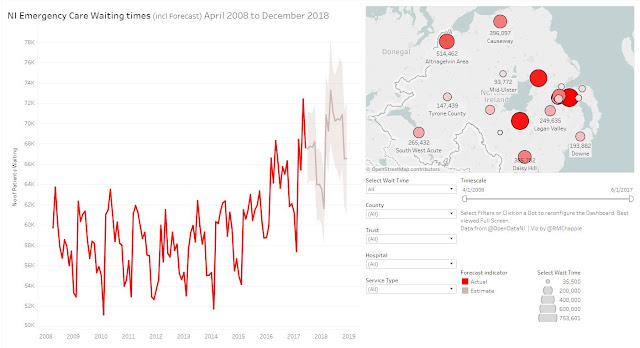
Screenshot of the Tableau Dashboard. Available [ here ] and at the end of this post. [Note: the dashboard is best viewed in Full Screen Mode ( F11  or icon at bottom right )] Having attended the rather excellent Open Data Camp 5 , held in Belfast over the weekend of 21-22 October 2017, I have returned to OpenDataNI’s datasets with renewed vigour and fervour. The first of these I’ve turned my attention to is the recently published  Emergency Care Waiting Times dataset. The Dataset The dataset is just over 2100 lines, representing monthly entries per Northern Irish hospital and running from April 2008 to June 2017. The dataset gives the numbers of patients who waited up to four hours, five to twelve hours, and over twelve hours. A further column gives the total number of patients in these three categories. As noted, the hospital name is given for each entry, and this is supplemented by the NHS Trust they work under and the Type of Emergency Department (1-3) p...

Belfast Bike Hire Rentals & Returns

Image
Screenshot of the Tableau Dashboard. Available [ here ] and at the end of this post. [Note: the dashboard is best viewed in Full Screen (F11) Mode] This Visualisation uses two datasources provided by OpenDataNI. The first is the Belfast Bike Hire Rentals and Returns dataset ( https://goo.gl/fjkRj3 ). Along with the numbers or Rentals and Returns, it is broken down by Location, Month, and Year. Each location name is accompanied by a Station Number. This is used as the key to join to the Belfast Bike Hire Stations dataset ( https://goo.gl/CxpjXM ) which, among other things, has contains the Latitude & Longitude (even if it is mistitled 'Longfitude'). There are a number of location naming inconsistencies in the Rentals data, so I've used the names as supplied in the Stations resource instead. The left side of the visualisation is taken up with a map of central Belfast. There is a dot for every Bike Station, sized by the number of Rentals or Returns & colou...

Renewable Heat Incentive (RHI) non-domestic beneficiaries: an interactive analysis of the data

Image
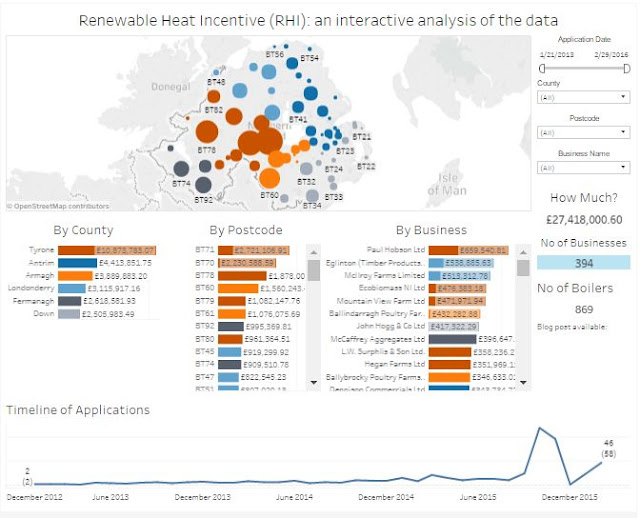
Screenshot of the Tableau Dashboard. Available [ here ] and at the end of this post. (Updated: see notes at end) After much legal wrangling and foot-dragging, the Northern Ireland Department of the Economy have finally published a partial list of recipients of money from the botched Renewable Heat Initiative scheme . At present only limited companies and limited liability partnerships who received in excess of £5,000 (cumulative) are listed. The data runs from the start of the scheme to 28 February 2017. After the list was published (16 March 2017) a number of people complained that they should treated as individuals, and not as limited companies. These corrections were made and a second list was issued the same afternoon. The dataset used here is based on this second list. The first thing I want to note about the document made available by the Department of the Economy is that it is presented as a PDF. This is data! To analyse data you need it in a suitable format su...

Finding your Public Amenities in Northern Ireland

Image
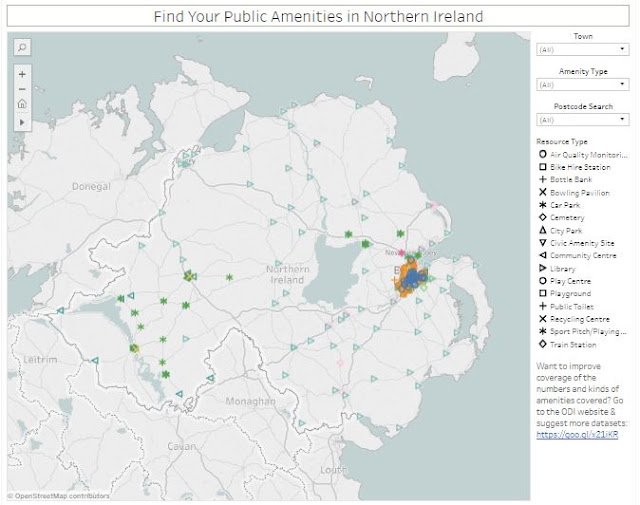
Screenshot of the Tableau Dashboard. Available [ here ] and at the end of this post. I was recently thinking back to last year’s ODI Belfast unConference where someone mentioned one of the smallest (and, by implication, the least useful) datasets available on their website [ here ] – the  list of 22 Bowling Pavilions in Belfast City. The question was ‘what can you possibly do with a list of 22 bowling pavilions?’ I seem to remember the suggestion that they might be useful in the event of a Zombie Apocalypse where they could be put to use as holding centres for the contaminated. I’m not a huge fan of the Zombie genre, but even I know that this approach will not end well. So … what do you do with a list of 22 Bowling Pavilions? This is a question that has been ticking away in the back of my head for a while now (wow … I really don’t have the richest internal life, do I?) … how do you use this kind of data in a useful way? Sure … I can build you a dashboard that shows all of...

Notifiable Infectious Diseases Reports (NoIDs) Northern Ireland | Trends & Predictions

Image
Screenshot of the Tableau Dashboard. Available  [here]  and at the end of this post. (Updated: see notes at end) The OpenDataNI website holds Notifiable Infectious Diseases Reports , provided by the Public Health Agency . The available data runs from Week 50 2014 to (at the time of writing) Week 50 2016. It is a relatively simple dataset, reported weekly, giving the numbers of occurrences of some 35 Reportable Diseases in Northern Ireland. The individual reports are based on figures recorded by the Duty Room and Surveillance. The reports also indicate that: “Food poisoning notifications include those formally notified by clinicians and reports of Salmonella, Campylobacter, Cryptosporidium, Giardia, Listeria and E Coli O 157 informally ascertained from laboratories.” What I wanted to do with this dataset was examine a few different ways that the selection of timescales can result in different understanding of the data and how it can be used to examine trends an...