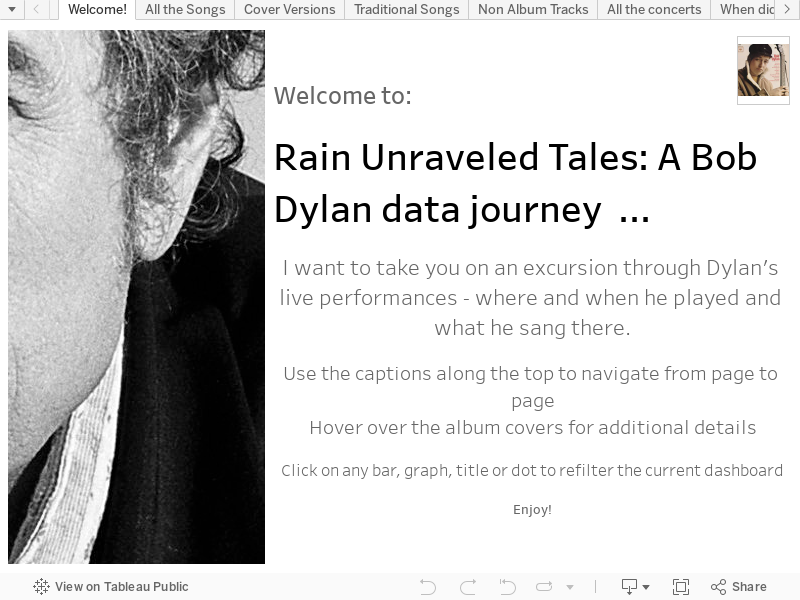
Rain Unraveled Tales: A Bob Dylan data journey ...

Screenshot of the Tableau Dashboard. Available [here] and at the end of this post.
Following on from my previous post about Bob Dylan and Tableau, I wanted to go back and revisit the datasource to see what else could be done with it and how else I could approach visualising the data. Rather than just writing it up for this blog, I though I'd take up a recent challenge to create a video blog or 'Vlog' as I'm assured all the cool kids call them ... so instead of reading my words, sit back, relax ... maybe put some Dylan on in the background ... and listen to me talk you through my latest Tableau Public data visualisation: Rain Unraveled Tales: A Bob Dylan data journey ...
If there are issues with this embedded version, try the dashboard on my Tableau Public page [here]. Similarly, if there are any issues with the video you can watch it on YouTube [here]


Comments
Post a Comment