Renewable Heat Incentive (RHI) non-domestic beneficiaries: an interactive analysis of the data

(Updated: see notes at end)
After much legal
wrangling and foot-dragging, the Northern Ireland Department of the Economy
have finally published a partial list of recipients of money from the botched Renewable Heat Initiative scheme. At present only limited companies and limited liability partnerships who
received in excess of £5,000 (cumulative) are listed. The data runs from the
start of the scheme to 28 February 2017. After the list was published (16 March
2017) a number of people complained that they should treated as individuals,
and not as limited companies. These corrections were made and a second list was
issued the same afternoon. The dataset used here is based on this second list.
The first thing I want
to note about the document made available by the Department of the Economy is
that it is presented as a PDF. This is data! To analyse data you need it in a
suitable format such as .xls or .csv. A PDF is wholly appropriate for certain
types of written reports, but not for data! To issue it only as a
PDF looks incredibly like deliberate foot-dragging and the intentional creation
of barriers to analysis. On the positive side, where there’s a will (& technology)
there’s a way and there are a number of free, online PDF to Excel converters
out there. I used Smallpdf [here].
The dataset itself is
pretty straightforward and includes the following columns:
Business
Name
Date
of Application
Company
Location by Trimmed Postcode
Technology
Type
Installation
Capacity (kWth)
Total
of payments made at 28 February 2017 (£)
Business Name
To ensure consistency,
I had to remove a few double spaces and a number of places where the same
company is given as ‘ltd’ instead of ‘Ltd’. Using Excel’s ‘highlight duplicates’ I
manually scanned all 869 rows of data to see if any anomalies stood out. There
is one entry for a ‘BP Mc Keefry Ltd’ and two for ‘BP McKeefry
Developments Ltd’. As both share the same postcode, they would appear to be
the same and I have consolidated them into one. ‘McGeary Metals Ltd’
and ‘McGeary Metals Ltd T/ A Portaquip’ are clearly the same entity and have
been grouped together. There are two entries for ‘Raymond Turkington
(Decorations) Ltd’ and one for ‘Raymond Turkington Dec Ltd’ that can be regarded as
identical and have been grouped together. There are three entries for ‘Spa Nursing Homes
Ltd’, one for ‘Spa Nursing Homes Ltd (Carryduff Nursing Home)’, and another
for ‘Spa Nursing Homes Ltd (Redburn Nursing Home)’. In all cases the postcode
is given as BT5, and I have taken the decision to group them as a single
entity. There is one entry each for ‘Merit Retail Ltd
T/A Cottage Care Home’ and ‘Merit Retail Ltd T/A Kilwee Care Home’. Again,
these have been grouped together. I also manually checked all the T/A (Trading
As) designations to ensure that there were no other duplicates. I think I got
them all, but some errors may remain.
Date of Application
This is given in the
format of DD/MM/YYYY. Because Tableau has given me problems in the past with
dates, apparently preferring them in the US MM/DD/YYYY format, I’ve broken this
column out into its component parts and reassembled it within Tableau with the
MAKEDATE() function. Application dates range from 21 January 2013 to 29
February 2016. This is in line with the actions of then Industry Minister,
Jonathan Bell, who at that time announced his intention to close the scheme to
new applications [source].
Thus, while payments continued after this point, the scheme was not open to any
new applicants.
Company Location by Trimmed Postcode
The dataset lists 64
unique trimmed postcodes, i.e. the first portion of the postcode (BTXX). It’s
sufficient to give a general location for an individual company, but not enough
to direct you to an individual street. I’ve used FreeMapTools [here]
to convert the shortened postcode to decimal Latitude and Longitude data. I
then manually allocated the postcodes to counties using the 'Towns, Counties,
Postcodes, UK!' Resource [here].
Some eight entries in the dataset give the postcode as BA14, which is not (to
my knowledge) a recognised format. In all cases these are National Trust
properties and are given in the following format:
National
Trust (Crom Estate)
National
Trust (Florence Court)
National
Trust (Giant's Causeway Visitors' Centre)
National
Trust (Innisfee)
National
Trust (Springhill House)
National
Trust (Springhill)
National
Trust (The Argory)
I’ve used simple Google
searches to ascertain the postcode for each. The resulting four trimmed
postcodes and ancillary data (Latitude, Longitude, and County) were already in
the dataset and required no further effort on my part. As ‘Springhill House’ and
‘Springhill’ are clearly the same property [here]
they have been merged into a single Business Name. In one case a ‘Bt’ had to be
sanitised to ‘BT’ because it confuses and annoys Tableau.
Technology Type
This column lists the
type of heat generating apparatus installed. In one instance (the National
Trust’s Giant's Causeway Visitors' Centre) this was a Ground Source Heat
Pump (GSHP). In all of the other 868 instances, this was a Solid Biomass
Boiler. No further analysis has been performed on this data.
Installation Capacity (kWth)
This column lists the Kilowatt-thermal
(kWth) capacity of the installed boilers and ranges from 15 to 999kWth, with a
mean of 104 kWth. Kilowatt-thermal (KWth) is defined as “A unit of heat-supply
capacity used to measure the potential output from a heating plant. It
represents an instantaneous heat flow and should not be confused with units of
produced heat (i.e., KWh(th), or kilowatt-hours-thermal).” [source]. No
further analysis has been performed on this data.
Total of payments made at 28 February 2017 (£)
Unsurprisingly, this is
the bit everyone’s interested in – the money! As noted previously, this dataset
only contains details of companies where total payments exceeded £5,000.
However, individual payments range from a modest £73.22 to an eye-watering
£252,844.05, thought the mean payment is still an impressive £31,577.61.
What it all tells us
There was quite a lot
of (mostly) small, niggley things to be done with the data to make it usable
and add the geographic component. But now that it’s here, what does it tell us?
In the first instance we can clearly see that this botched scheme has resulted
in the payment (so far) of £27,418,000.60 to 394 limited companies and limited
liability partnerships. We can easily see that the top beneficiaries are as
follows:
Paul Hobson Ltd £659,540.81
Eglinton (Timber
Products) Ltd £538,885.63
McIlroy Farms Limited £513,312.78
Ecobiomass NI Ltd £476,383.18
Mountain View Farm Ltd £471,971.94
We can also see that
the lion’s share of payments went to County Tyrone (£10,873,783.07), while Co.
Down received the least (£2,505,983.49). The figure for Tyrone is so large, it’s
in excess of the amount granted to businesses in Londonderry, Fermanagh,
and Down – combined! This disparity makes more sense when viewed in terms of
the numbers of businesses claiming in each county. Londonderry, Fermanagh, and
Down have, respectively, 48, 32, and 49, while Tyrone has 142. Looking at the
data by postcode it’s not particularly surprising that the top three postcodes
in terms of moneys spent are all in Tyrone: BT71 (£2,721,106.91 to 29 companies),
BT70 (£2,230,588.59 to 32 companies), and BT78 (£1,878,000.19 to 24 companies).
This is followed by BT60 in Armagh (£1,560,243.48 to 16 companies) and BT79
also in Tyrone (£1,082,147.76 to 18 companies).
So far, so good! While
it’s clear that few people outside of Northern Ireland care about this scandal,
the local press have made good headway with the data. The Belfast Telegraph
have provided an overview of the dataset [here].
The Irish News have written on the list of recipients generally [here
| here];
have broken down the list into the top 10 beneficiaries, and examined the
contribution to broad groups such as Churches, Government Buildings, Golf
Clubs, the Leisure Industry, Poultry farms, etc. [here];
as well as providing reports on a variety of individual companies [here
| here
| here].
Some news reports have
discussed the spike in applications when it was mooted that the scheme should
be closed to new applicants. However, no one (that I am aware of) has examined
the financial impact of this sudden jump. In the period from 1-30 October 2015 118
companies made applications to the scheme for 266 boilers. A further 95 companies
applied for 179 boilers in November 2015. This is in stark contrast to the 24
that made applications for 40 boilers in September 2015 and the 10 applications
for 14 boilers in August 2015. Seeing such a defined spike in the data, it is
hard to believe that there was not a sudden, orchestrated stampede to get on board
before the gates closed for good. Taking just those two crucial months of
October and November 2015, it is clear that some 201 companies joined the scheme
and that it has so far cost £12,571,575.20 – almost half of the total for the
RHI scheme as a whole.
The Tableau Dashboard
The professional
journalists have done an excellent job of examining this data and making it
available to the wider public. However, where the Tableau Dashboard I have
created has an edge is that it allows the user to investigate the data in their
own way, finding the information that is most of use and interest to them, even
if it’s not part of the chosen journalistic narrative.
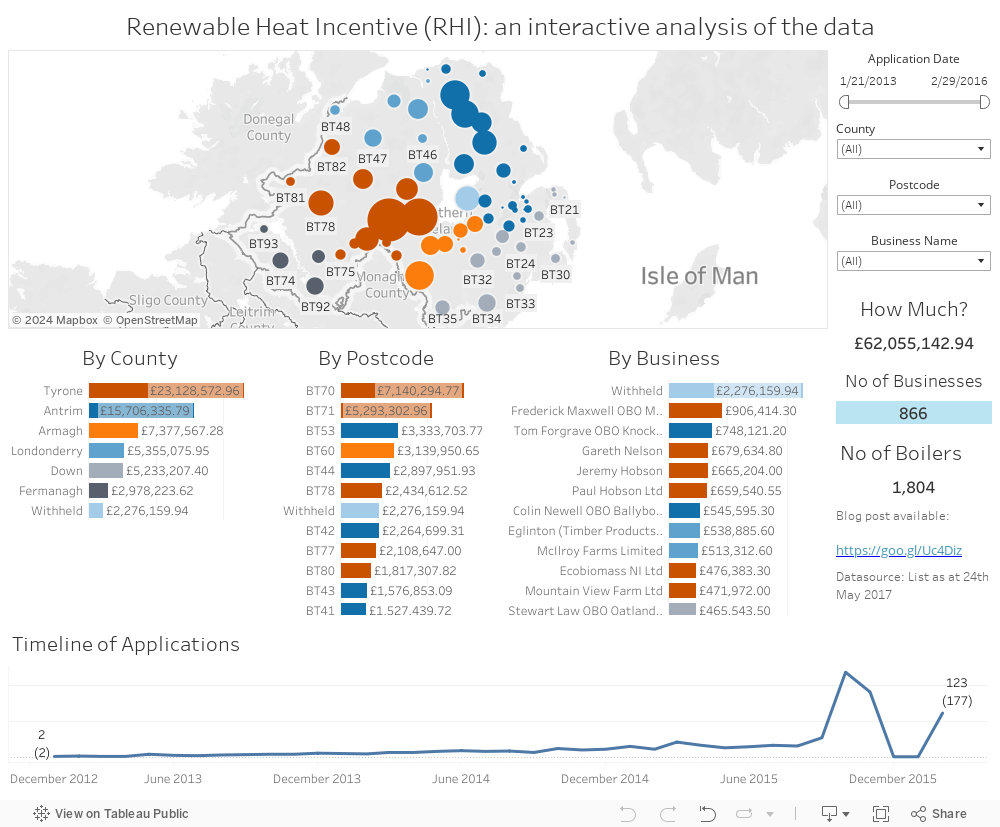
The top portion of the dashboard shows a map of Northern Ireland with dots representing each postcode (coloured by county) with the size of the dot determined by the amount of money paid out by the RHI scheme to each. The central band of the dashboard breaks the data out into three bar charts (sorted highest to lowest) showing the amounts received By County, By Postcode, and By Business (all coloured by county). Finally, the bottom portion of the dashboard is a line graph, running from January 2013 to November 2015, showing when various companies made applications to the scheme. This is followed by a figure in brackets detailing the number of individual boilers applied for.
The top portion of the dashboard shows a map of Northern Ireland with dots representing each postcode (coloured by county) with the size of the dot determined by the amount of money paid out by the RHI scheme to each. The central band of the dashboard breaks the data out into three bar charts (sorted highest to lowest) showing the amounts received By County, By Postcode, and By Business (all coloured by county). Finally, the bottom portion of the dashboard is a line graph, running from January 2013 to November 2015, showing when various companies made applications to the scheme. This is followed by a figure in brackets detailing the number of individual boilers applied for.
As with all of my
Tableau dashboards, it is fully interactive and clicking on a dot or bar will
re-filter the entire dashboard accordingly (ctrl+click to select multiple marks).
It is worthwhile noting that some companies are associated with multiple postcodes
in two or more counties, leading to different colours on their bars. In this
instance, clicking on the company name will show the entirety of their receipts
from the scheme, while clicking on individual portions of the bar will show only
the data for that particular county. Likewise, clicking on the names of
counties or postcodes on the other bar charts will filter down company receipts
to that level of detail.
The panel on the right
of the dashboard provides filters that allow the user to quickly get down to
their preferred level of detail. These include checkbox dropdowns for County,
Postcode, and Company, along with a callipers-style slider to refine the Application
date range. Finally, there is a handy ‘How much?’ total that sums up the spend
for the current view, along with the ‘No of Companies’ and the ‘No of boilers’
in that view.
The professional
journalists have had their say. I’ve had mine too. The political classes and
the various vested interests will – undoubtedly – have theirs for some
considerable time to come. This interactive dashboard now gives you, the
reader, the opportunity to directly engage with the data, find the stories that
are of importance to you, and draw your own conclusions. Go look – you may find
something everyone else has missed!
The Future
The Department of the
Economy’s webpage for this datasource notes that “Another list of the
individuals who are in receipt of payments of £5000 or more under the
non-domestic scheme will be published in the next few weeks.” The page also notes that the
Department is considering updating both lists on a six-monthly basis. Aside
from making the corrections I’ve listed above, and the change to a more easily
manipulated format, I would love to see the Department break out the
information into the time periods of when payments were made, as well as when
the original application was made. However they progress with this release of
data, it is clear that the scheme will continue to cost us dearly long into the
future and that there will be much room - and need - for coherent data
analysis.
Notes
The Renewable Heat Association is at pains to
point out that just because an individual or company is on this list, they
can not be thought of as doing wrong in any way. That’s why they’ve gone to the High
Court to attempt to suppress this data and, in a separate action, attempted to
secure the continued payment of funds for the next 20 years.
The colour scheme for
the counties uses Tableau’s native ‘Color Blind’ palette. To non-colour blind
viewers it may seem somewhat garish, but it works for us!
Many thanks to my good
friend Maarten for alerting me to the availability of this dataset – even if he
did chide me for not taking a laptop on holiday …
If there are issues with this embedded version, try the dashboard on my Tableau Public page [here]
31 March 2017. Updated to revised list as at March 28 2017
24 March 2017. Updated to revised list with individual beneficiaries.
25 March 2017. Dashboard featured on The Irish News' digital edition [here]
31 March 2017. Updated to revised list as at March 28 2017
24 March 2017. Updated to revised list with individual beneficiaries.
25 March 2017. Dashboard featured on The Irish News' digital edition [here]


Hi Robert, Susan here from the Irish News. Great piece. Could we embed this into an article and credit you? Thanks, Susan
ReplyDeleteHi Susan! Please feel free to embed & share in any way that's appropriate. R
Delete