OpenRefine – an experiment in data cleaning
 |
| Photo by r2hox (Flickr/Creative Commons) |
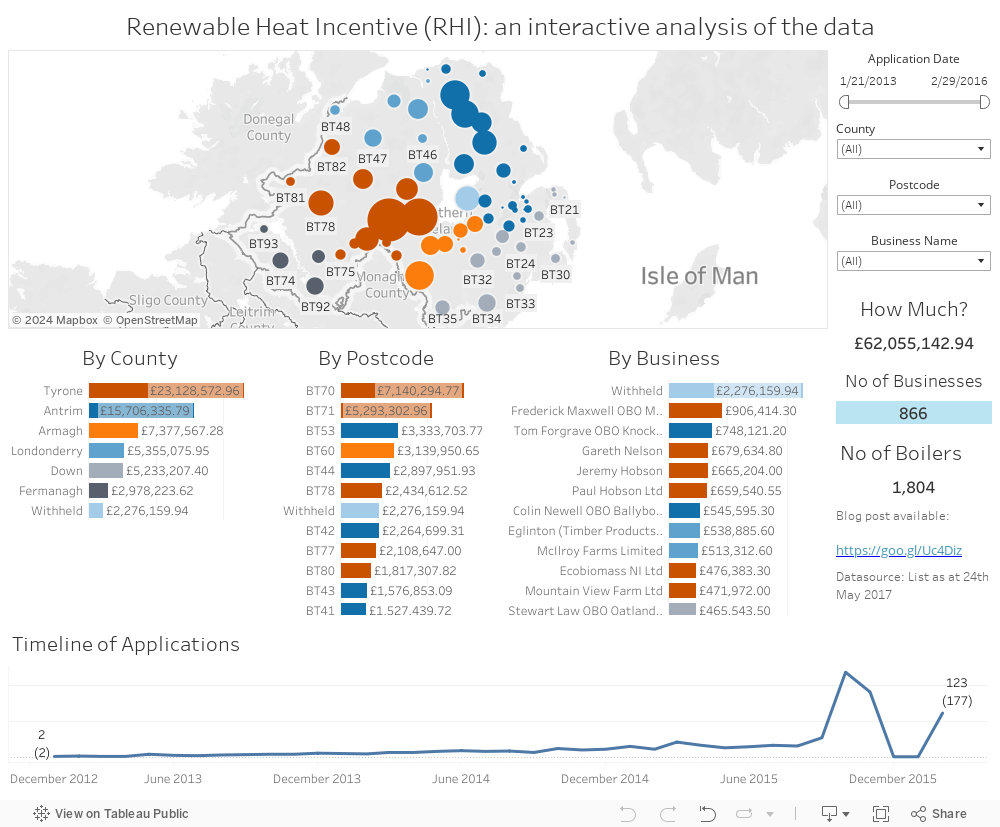
In a recent blog post
on Northern Ireland’s Renewal Heat Incentive (RHI) scandal [here]
I spent quite a bit of time recording all of the changes, tweaks, and decisions
I had to make to get the data into a usable format. With any dataset it is
important to understand the transformations that went into bringing it to its
final form. If other researchers are unable to follow your process and
consistently achieve the same results from the same dataset it brings your
analysis into question. Beyond that, it brings the whole endeavour of data
science and data analysis into disrepute. If you can’t rely on the figures to
tell a consistent story, you can’t make consistent decisions, and you can’t gain
reliable insights. You certainly can’t trust the folks who are furnishing you
this flawed and unreliable nonsense. If you can’t rely on the information
you’re seeing on your dashboard, what is it other than a collection of
interesting, but meaningless, colours and shapes?
While this should be a
consideration for any dataset you look at, it’s particularly apposite in this
instance. Even leaving aside the fact that the beneficiaries of the botched
scheme went to the High Court to try and suppress it, it’s a dataset that
essentially brought down the Northern Ireland Assembly, redrew the political
map here, and will have long-lasting impacts on how we are governed.
The other thing that was
on my mind was the fact that the Department of the Economy’s website said that
they were preparing a similar dataset of the private individuals who received
money from the scheme and that both lists would probably be updated on a
six-monthly basis. If there is sustained interest in this scandal (and the
dataset), I’ll probably be quite keen to keep the dashboard up to date. The
problem here is, of course, that I’m peculiarly lazy and the thought of
endlessly repeating all of my carefully outlined steps with each new release of
data just fills me with dread.
There is a whole
industry dedicated to data cleansing, and the brightest light in this firmament
is Alteryx. I’ve seen these guys demo
their product on a few occasions and it is simply stunning. Their website is
littered with the logos of all the huge, instantly-recognisable corporations
they serve. Understandably, their fee structure is commensurate to the work
they do. Equally understandable is the fact that this is way beyond the financial
reach of a blogger like me, so I need to find something else. I’ve been looking
around at a number of more affordable options when I happened to fall upon OpenRefine (formerly Google Refine). You can
find out all about it on their web page [here]
where you can buy a book and watch some training videos. My initial reaction to
the product is that it is really powerful and probably would require a significant
expenditure of time and mental energy to get the fullest out of it. That said,
I watched the three training videos on their site twice (the second time,
taking notes). That has been the entirety of my training with the product. It
was still sufficient to work through the list of changes I’d made to the
original dataset and in about the same amount of time it originally took to
complete. I’d particularly note the automated clustering feature that
independently noted a number of the near identical Business names I’d spotted
manually. It also discovered a couple that I’d missed the first time round.
But here’s the good bit
– it’s not just done for now and the next time the Department make an updated
version I’ve got to do it all again. OpenRefine allows the user to export the
actions taken as a JSON script. It not only allows you to run through the
process you created in a matter of seconds, it is easily publishable and can be
reviewed by other researchers to ensure consistent, robust datasets and analyses.
It is, of course, early
days, but I already feel that OpenRefine will become a permanent fixture of my
data analysis. One thing I am certain of is that when the Department of the
Economy publishes the next dataset of RHI beneficiaries, I’ll be ready, knowing
that my inherent laziness is no impediment to decent quality data analysis!
If you want to
replicate my analysis or error check my process, I’ve made the JSON file
available [here]
[... a little time passes ...]
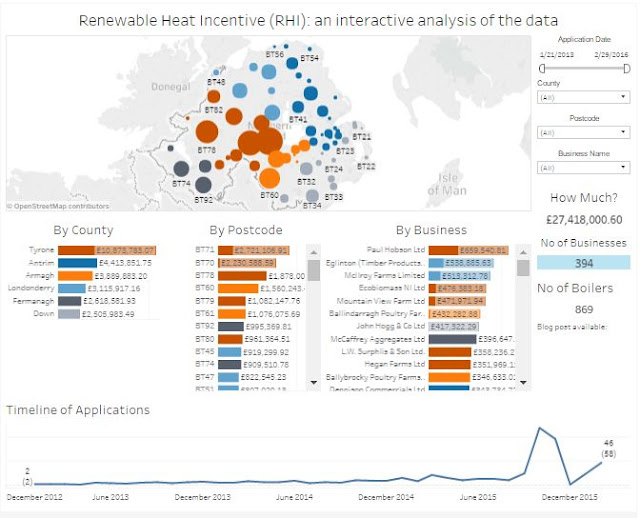
The above blog has been sitting on the server for about a week or so and I've been toying with the idea as to when would be the best time to publish it. The thing that has been on my mind is that it's lovely (if a but gushy) and it doesn't have any follow up in terms of how repeatable the process is. Well ... I was browsing the internet yesterday afternoon and happened upon the Department of the Environment's website [here] (Yep! I'm totally Rock 'n' Roll). They note that the previously available list had a number of errors that they've now fixed and that the list has been republished. In their accompanying list of errata [here], it's clear that these are not big changes - Green Energy Engineering had seven boilers, not nine; Stephens Catering Co Ltd had only one boiler, not five; and two companies with three boilers were added to the list. While there are significant amounts of money involved, the changes to the dataset aren't huge. This is also the situation I had dreaded - the idea of starting over from scratch having to make the same edits and changes over and over for little reward ... it was just! so! dull!
My first instinct was to simply go to the excel sheet and do the edits manually, but then I thought: "OpenRefine! Let's see how well this works!" ... I downloaded the PDF (come on Dept of Economy! ... it data - publish it as a spreadsheet ... how is this difficult to understand?), converted it to Excel (thank you Smallpdf), started OpenRefine, opened the sheet, found the document where I'd saved off the JSON of the process, hit Apply > Perform Operations. Boom! it was done! Two hours of work last week reduced down to less time than it takes to type this sentence! ... Actually, it was done in less time than it takes to read this sentence! After that it was simply a case of exporting it out & badda bing, badda boom updated Tableau dashboard. Seriously, what is not to like?
The original blog post is [here] and the updated dashboard is below (or on TableauPublic if you have any difficulties [here]). You won't notice much change in the actual data (the scheme has already cost us over £27m and the number of boilers has only dropped from 869 to 866), and you certainly won't notice how easy OpenRefine made the process ... and that's as it should be!
[... a little time passes ...]
The above blog has been sitting on the server for about a week or so and I've been toying with the idea as to when would be the best time to publish it. The thing that has been on my mind is that it's lovely (if a but gushy) and it doesn't have any follow up in terms of how repeatable the process is. Well ... I was browsing the internet yesterday afternoon and happened upon the Department of the Environment's website [here] (Yep! I'm totally Rock 'n' Roll). They note that the previously available list had a number of errors that they've now fixed and that the list has been republished. In their accompanying list of errata [here], it's clear that these are not big changes - Green Energy Engineering had seven boilers, not nine; Stephens Catering Co Ltd had only one boiler, not five; and two companies with three boilers were added to the list. While there are significant amounts of money involved, the changes to the dataset aren't huge. This is also the situation I had dreaded - the idea of starting over from scratch having to make the same edits and changes over and over for little reward ... it was just! so! dull!
My first instinct was to simply go to the excel sheet and do the edits manually, but then I thought: "OpenRefine! Let's see how well this works!" ... I downloaded the PDF (come on Dept of Economy! ... it data - publish it as a spreadsheet ... how is this difficult to understand?), converted it to Excel (thank you Smallpdf), started OpenRefine, opened the sheet, found the document where I'd saved off the JSON of the process, hit Apply > Perform Operations. Boom! it was done! Two hours of work last week reduced down to less time than it takes to type this sentence! ... Actually, it was done in less time than it takes to read this sentence! After that it was simply a case of exporting it out & badda bing, badda boom updated Tableau dashboard. Seriously, what is not to like?
The original blog post is [here] and the updated dashboard is below (or on TableauPublic if you have any difficulties [here]). You won't notice much change in the actual data (the scheme has already cost us over £27m and the number of boilers has only dropped from 869 to 866), and you certainly won't notice how easy OpenRefine made the process ... and that's as it should be!


Comments
Post a Comment