Posts

Stop Eating Dog Food – Start Drinking Champagne!

Image
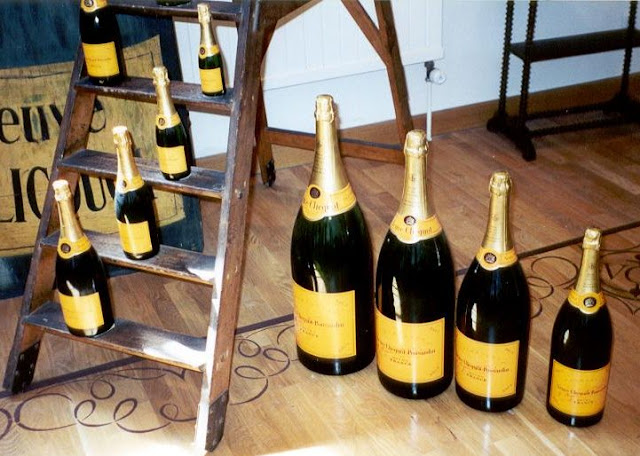
Photo by Walter Nissen (Wnissen). (Own work) [Public domain], via Wikimedia Commons I first encountered the term ‘Dogfooding’ or ‘to eat your own dog food’ last year at the 2016 Tableau conference in Austin, TX. I was attending a session on how Tableau use their own product to visualise their HR data. The presenter uttered the line ‘We firmly believe in eating our own dog food’. The meaning was immediately clear to me – if it’s not good enough for internal usage, it’s hard to make the case that others should invest in the product. Literally: if it’s not good enough for me, it’s not good enough for my dog. Great … I get the idea fully & clearly … Unfortunately, I also have a strong smell-memory of dog food that’s triggered every time I hear the term. I’m not joking! As I’m writing this the air is heavy with the imagined scent of tinned dog food … it’s not pleasant! Once the Tableau presentation ended I was free of the term – while it may have some currency in the US

Emergency Care Waiting Times in Northern Ireland 2008-2017 and forecasting the future

Image
Screenshot of the Tableau Dashboard. Available [ here ] and at the end of this post. [Note: the dashboard is best viewed in Full Screen Mode ( F11  or icon at bottom right )] Having attended the rather excellent Open Data Camp 5 , held in Belfast over the weekend of 21-22 October 2017, I have returned to OpenDataNI’s datasets with renewed vigour and fervour. The first of these I’ve turned my attention to is the recently published  Emergency Care Waiting Times dataset. The Dataset The dataset is just over 2100 lines, representing monthly entries per Northern Irish hospital and running from April 2008 to June 2017. The dataset gives the numbers of patients who waited up to four hours, five to twelve hours, and over twelve hours. A further column gives the total number of patients in these three categories. As noted, the hospital name is given for each entry, and this is supplemented by the NHS Trust they work under and the Type of Emergency Department (1-3) provided.

Belfast Bike Hire Rentals & Returns

Image
Screenshot of the Tableau Dashboard. Available [ here ] and at the end of this post. [Note: the dashboard is best viewed in Full Screen (F11) Mode] This Visualisation uses two datasources provided by OpenDataNI. The first is the Belfast Bike Hire Rentals and Returns dataset ( https://goo.gl/fjkRj3 ). Along with the numbers or Rentals and Returns, it is broken down by Location, Month, and Year. Each location name is accompanied by a Station Number. This is used as the key to join to the Belfast Bike Hire Stations dataset ( https://goo.gl/CxpjXM ) which, among other things, has contains the Latitude & Longitude (even if it is mistitled 'Longfitude'). There are a number of location naming inconsistencies in the Rentals data, so I've used the names as supplied in the Stations resource instead. The left side of the visualisation is taken up with a map of central Belfast. There is a dot for every Bike Station, sized by the number of Rentals or Returns & colou

United States Federal Executive Orders

Image
Screenshot of the Tableau Dashboard. Available [ here ] and at the end of this post. [Note: the dashboard is best viewed in Full Screen (F11) Mode] Back in early 2016, when Trump was still seen as unelectable, he directed a portion of his Twitter barrage against President Obama on the latter’s use of Federal Executive Orders . I’m not going to pretend that I’m so politically astute that these comments caught my attention at that time. However, when commentators started to contrast Trump’s statements with his actions once in office, I immediately felt that this was a place where a visualisation of the data would be of use and interest. In my defence, I would note that I’m not so naïve that I believe that actual facts and figures hold sway any longer in either US or British politics … we can but try! The datasource My initial experimentations and explorations of this data started with the List of United States federal executive orders Wiki page. This is quite high-level d

Global Terrorism. A Visual Analysis

Image
Screenshot of the Tableau Dashboard. Available [ here ] and at the end of this post. I recently wrote about my initial experiments in visualising data relating to terrorist attacks . My conclusions were that although the dashboard accurately portrayed the underlying data, I needed a better datasource to provide more detail and a broader context. After a bit of digging, I found a series of Wikipedia pages that attempt to collate all known terrorist attacks across the globe on a month by month basis. This data runs from the present time back to January 2015 [ 2015 , 2016 , & 2017 ]. Before this, Wikipedia has data available for the period from 2010-2014 broken into 6-month blocks and data from 1970-2009 is available in whole year pages. I’ve elected to restrict my choice of data to the period from 2015 onwards for a number of reasons. A brief perusal of the earlier data confirmed that while it was richer and more detailed than what I had used previously, it was still not full

Terrorism in Europe 1867-2017. Initial Experiments with the Data

Image
Screenshot of the Tableau Dashboard. Available [ here ] and at the end of this post. In the aftermath of the attacks at the Manchester Arena in May 2017 and at London Bridge the following month, I felt that I wanted to take a closer look at data relating to terrorist attacks across Europe. At a purely personal level, my hope was to discern patterns and provide a broader context for my own understanding. In searching for a suitable data asset, I encountered the Terrorism in Europe Wikipedia page. The data doesn’t attempt to cover every incident, limiting itself to those where 10 or more people (including the perpetrators) died. It also consciously defines actions by State actors as beyond the definition of terrorism – a nuance lost on some critics of both the dashboard and the underlying data. The Data One chief attraction from the point of view of creating a visualisation is that the data in the Wiki article was relatively clean and needed relatively little tweaking to m

Rain Unraveled Tales: A Bob Dylan data journey ...

Image
Screenshot of the Tableau Dashboard. Available [ here ] and at the end of this post. Following on from my previous post about Bob Dylan and Tableau , I wanted to go back and revisit the datasource to see what else could be done with it and how else I could approach visualising the data. Rather than just writing it up for this blog, I though I'd take up a recent challenge to create a video blog or 'Vlog' as I'm assured all the cool kids call them ... so instead of reading my words, sit back, relax ... maybe put some Dylan on in the background ... and listen to me talk you through my latest Tableau Public data visualisation:  Rain Unraveled Tales: A Bob Dylan data journey  ... If there are issues with this embedded version, try the dashboard on my Tableau Public page [ here ]. Similarly, if there are any issues with the video you can watch it on YouTube [ here ]