Finding your Public Amenities in Northern Ireland
 |
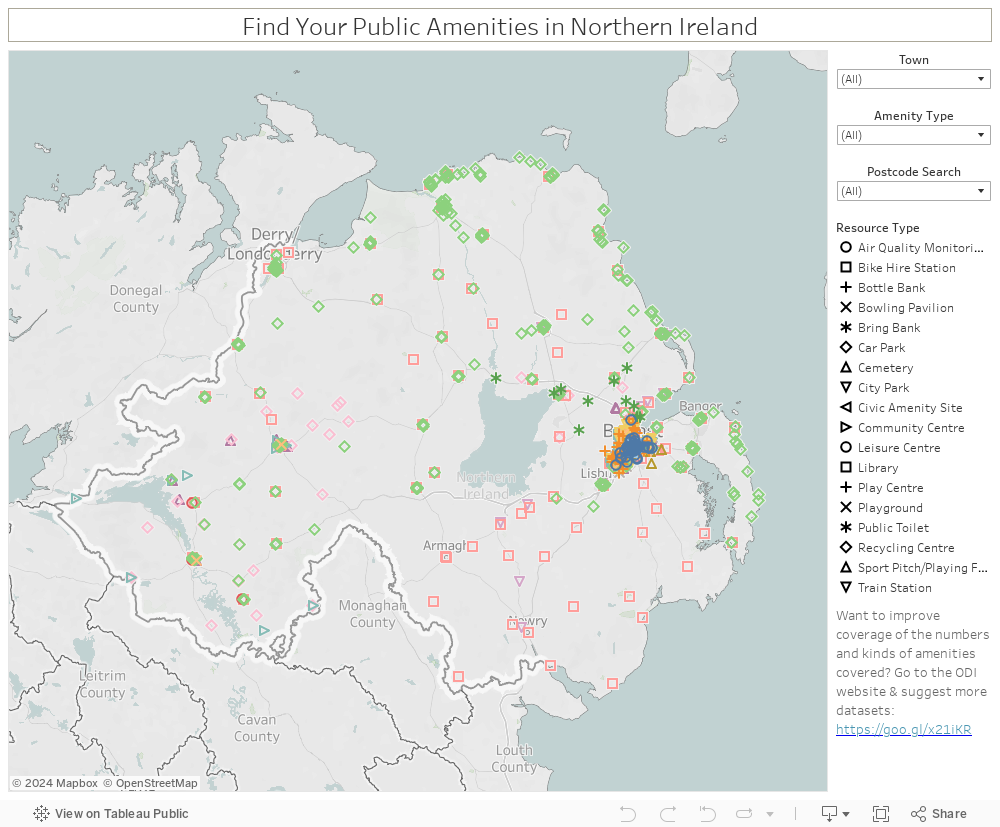
| Screenshot of the Tableau Dashboard. Available [here] and at the end of this post. |
I was recently thinking
back to last year’s ODI Belfast unConference where someone mentioned one of the
smallest (and, by implication, the least useful) datasets available on their
website [here] – the list of 22 Bowling Pavilions in Belfast City. The
question was ‘what can you possibly do with a list of 22 bowling pavilions?’ I
seem to remember the suggestion that they might be useful in the event of a
Zombie Apocalypse where they could be put to use as holding centres for the
contaminated. I’m not a huge fan of the Zombie genre, but even I know that this
approach will not end well. So … what do you do with a list of 22 Bowling
Pavilions? This is a question that has been ticking away in the back of my head
for a while now (wow … I really don’t have the richest internal life, do I?) …
how do you use this kind of data in a useful way? Sure … I can build you a
dashboard that shows all of their locations … but how is this of any use to
anyone? As I’ve scoured the ODI website looking for interesting datasets to
work with, I’ve noticed several of these relatively small lists and, again,
thought ‘what can you do with this?’ It eventually occurred that I was looking
at this kinda’ the wrong way – these lists may have relatively little value on
their own, but they might have quite a bit more significance if they were all
brought together.
What’s in the dataset?
With that in mind, I’ve
brought together 20 relatively small datasets, all around the theme of public
amenities of one kind or another. The datasets break down into three broad
categories:
11) Those
covering all of Northern Ireland
Libraries [98]
Railways Stations [19]
22) Those
covering Belfast
Play Centres [6]
Community Centres [22]
City Parks [44]
Cemeteries [8]
Bowling Pavilions [11]
Playgrounds [76]
Civic Amenity Sites [2]
Bottle Banks [45]
Air Quality Monitoring Stations [44]
Public Toilets [14]
Recycling Centres [4]
Sport Pitches Playing Fields [37]
Bike Hire Stations [33]
Bowling Pavilions [22]
33) Everywhere
else
Bowling Pavilions (Fermanagh & Tyrone) [2]
Community Centres (Fermanagh) [9]
Car Parks (Fermanagh) [39]
Car Parks (Antrim and Newtownabbey Borough Council) [11]
My first instinct was to omit the
datasets from everywhere outside Belfast and weed out the NI-level ones to the
same end. Although this would have left a very neat Belfast-only dataset, I was
reluctant to go that direction for two reasons. Firstly, Belfast is frequently
privileged above the rest of Northern Ireland and it wasn’t something I wanted
to perpetuate if there was data (however patchy) that could be used to address
the balance. The second reason is the explicit idea of the ODI case studies
series – to not just show off the Open Data available and how it can be used,
but to impress on key stakeholders that their data is relevant, useful and
should be made available. Here, the blanks on the map serve the purpose of
showing areas of Northern Ireland where data on public utilities is missing,
but would be of particular use.
What had to be done to
the data?
Not all data is created
equal, even when it originates within the same organisation. Tableau only uses
location data in the format of digital degrees and I wanted the map to filter
on the first part of the postcode, so it was inevitable that some work would be
necessary. For example, some datasets were presented with only Irish Grid
co-ordinates. In these cases I used a batch co-ordinate converter created by
Barry Hunter [here]
to translate the data to digital latitude and longitude. These datasets
include: Air Quality Monitoring Stations; Fermanagh & Tyrone Bowling
Pavilions; Fermanagh Community Centres; Libraries; Recycling Centres; Train
Stations.
Other datasets came
without any form of UK postcode and I used Chris Bell’s fantastic Batch Reverse
Geocoding tool [here].
These datasets included: Air Quality Monitoring Stations; Bike Hire Stations;
Belfast Bowling Pavilions; Public Toilets; Sport Pitches and Playing Fields; Train
Stations. Two of the Playing Fields could not be easily assigned a postcode by
this method, but a little strategic Googling soon provided an answer.
It would be churlish
not to note that most datasets were perfect for my needs and required no
further manipulation. These included: Bottle Banks; Car parks; Cemeteries; City
Parks; Civic Amenity Sites; Belfast Community Centres; Play Centres; Playgrounds.
Overall, I’d urge any
organisation considering making their data available to the ODI (or anyone
else) to strive to offer the maximum amount of detail in terms of location –
full postcodes, grid co-ordinates, and latitude and longitude. As different
users and technologies will have varying needs and plans for the data,
increasing its usability can only be a good thing.
What’s not in the
dataset?
The ODI website
contains a list of nearly 16,000 Translink Bus Stops [here].
While it contains both easting/northing and latitude/longitude locations, it
did not have postcode data that would allow me to filter it in the way I wanted
to with the other datasets. I thought about various ways of countering this,
but the idea of attempting to process all those points just seemed
overwhelming, so I’ve opted to leave them out of this visualisation. But now
that you know that they’re available, I’m sure you can find something useful
and interesting to do with them ...
Tableau
Once the data has been
wrangled into submission, creating a visualisation in Tableau is
straightforward. All it requires is a map with filters for 16 utility types; 90
cities, towns, and villages; and 85 shortened postcodes. From the Tableau side,
I was keen to try out the device specific layouts functionality that came with
Tableau 10.0. To this end, I designed three distinct versions of the dashboard:
for PCs, for tablets, and for smart phones. To say that this didn’t work out well
is an understatement … at least at first. The tablet version worked on my
Kindle Fire, but it was also the version that appeared on my laptop. True, it
still worked … just not the way I wanted it to. The worst one was the smart
phone design … every time I opened a filter it took up the entirety of the
screen and refused to close once I’d made my selection. This issue was fixed by
adding an ‘apply changes’ button that also closed the filter. The
Laptop/Desktop issue is a bit trickier and appears to revolve around the
generic sizing I’ve used/are offered by Tableau. I’ve definitely more to learn
and develop in this area! Another thing I learned about Tableau is that you cannot combine shapes and colours as marks. True, there are work-arounds, but it is something that just feels like it should be native to the tool. Thankfully, I am not alone in this feeling and the idea is already on Tableau's community pages as a suggested future enhancement.
Overall thoughts
While Tableau is a
great tool for investigating geographical data – and I’ve used it many times
for just this purpose – I feel unconvinced by its ability to function as a gazetteer
of local services. It’s not that there’s anything inherently bad about it as a
tool, just that traditional app development could probably deliver a better,
more integrated, and fully-featured experience. The initial point of this
exercise was to examine how useful the data is and it seems to me that not only
do these individual datasets have value, but that value exceeds the sum of the
parts when combined. It is clear that Belfast City Council has taken an
important lead in this initiative. Beyond increasing the numbers of datasets
they make available, I would urge them to consider (as I have outlined above) increasing
the amount of information they include. Beyond this, I feel that careful
thought should be given to standardising the format of the datasets across the
organisation so that each uses the same basic columns and column headers so
they may be integrated more easily. Outside of Belfast there is so much work to
be done, but the initial steps have been taken in Fermanagh, Tyrone, and by Antrim
and Newtownabbey Borough Council. What is needed is more data – robust,
well-organised, reliable data … and more of it! Again, the same recommendation
would apply as before, to adopt high quality standards that ensure clear,
consistent datasets.
Each of these .csv
sheets is of little use on their own. It’s when they’re combined together with
other similarly ‘slight’ resources they become worth more than the sums of
their parts … what we have now is pretty good and could point the way for Belfast
City Council or an Northern Ireland-wide project. While the presence of obvious
geographic ‘holes’ in the data is usually a cause for dismay, here they should
be viewed as opportunities for improvement!
Update.
In discussing this
project with Suzanne McLaughlin of OpenDataNI it was pointed out to me that I
had accidentally omitted six sets of car park data. I’ve returned to the
dataset and now added the missing 234 entries. The issues I described previously
apply equally here, so I won’t labour the point. I will, however, mention two particular
data issue. In the first case, somehow one of the co-ordinates in the Causeway
Coast and Glens data got transposed into the Longitude column. When I attempted
to batch reverse geocode these locations to get postcodes, I was surprised to
find that Shore Street Car Park, Cushendall, had been mysteriously transported
to Northern Kazakhstan. Even when attempting to use the given co-ordinates to
get a Latitude and Longitude, I ended up with a dot on the map, approximately
100 miles north-west of Belmullet, Co. Mayo, far out in the North Atlantic. I eventually
had to settle for a much less accurate location based on a best guess. The
second data issue was associated with the dataset supplied by Derry City and
Strabane District Council. Here, the street address, town, and postcode were concatenated
into a single string (e.g. “Market
Square, Claudy BT47 4AA”). While this may be human-readable, it limits its easy
use in computerised systems. Although there were only 28 records, it took more a
certain amount of time to split the whole out into usable pieces. My point here
is not to belittle the efforts of any particular organisation for the data they’ve
made available. Instead, it highlights the need for robust, accurate data
provided in forms that are consistent and easily machine readable. As an aside,
I would also note that while issues like the incorrect location are difficult
to spot in a datatable, they are abundantly clear as soon as that data is
visualised!
The additional sets of
car park data are as follows:
Belfast [30]
Ards & North Down [31]
Mid Ulster [22]
Causeway Coast and
Glens
Mid and East Antrim
Borough Council
Derry City and Strabane
District Council [28]
28 March 2017:
Added - Antrim and Newtownabbey Borough Council Household: Recycling Centres & Bring Bank Locations
30 April 2017:
Added - Fermanagh & Omagh District Council: Leisure Centres
Added - Fermanagh & Omagh District Council: Recycling Banks
Added - Fermanagh & Omagh District Council: Sport Pitches
20 May 2017:
Added - Lisburn & Castlereagh City Council: Car Parks
Added - Causeway Coast and Glens Borough Council: Car Parks


Comments
Post a Comment