The inevitable first post explaining the choice of name …
Hello & welcome to
my data visualisation blog demonCoreData.
It has been almost five
years since I left* professional archaeology. Over that time I attempted to carve
out a new career in IT and, over the past couple of years in particular, in the
field of data visualisation. I still retain my passion for archaeology, but I
currently work as a Tableau developer for a large IT company here in Belfast. Outside
of work, I use the skills I’ve gained in Tableau to produce visualisations of
various datasets that interest and intrigue me. Some visualisations I do as a
means of expanding my skillset; some I do to think through work-based
challenges using non-sensitive data that can be freely shared with colleagues
and subject matter experts; and some I just do for the sheer joy of seeing raw
data turn into images and jump around the screen!
Rather than post the
visualisations I create solely to my Tableau Public page, I’ve been thinking that
it would be nice to have a place where I can add a little more in terms of explanations,
discussions, and that sort of thing … basically, a bit more than the 150 or so characters you get to describe your Viz on Tableau Public …
… it might even be good
…
What’s with the name though? …
Over the summer of 2016
I was in the wonderful position of being repeatedly asked to produce a range of
Tableau dashboards for a wide assortment of leaders and managers, often to
decidedly aggressive timelines. I frequently found that while the dashboards
could be created quickly enough, it could be difficult to arrange the server
space to securely host them. Our Tableau Server folks are brilliant, but it
gets tedious for everyone when you’re repeatedly asking for special
dispensations to jump queues and pull out all the stops for you.
I reckoned that the way to get around this was to have a personal space on the server that I could re-purpose as the need arose … no more hassling the hard-working server guys … everybody wins! I got as far as filling out the request to create the folder when I was asked for what it should be called. I was honestly fed up of using dull (but appropriate) titles for all the projects I had recently created and I didn’t want to continue the trend. I really didn’t think I needed something called ‘SecureTemporaryProject’ (or similar) in my life … I wanted something interesting, unusual, and easy to remember … so I went with the first thing that entered my head … however, it appears that the first thing that that entered my head was Randall Munroe’s XKCD comic … specifically his Scary Names graph … I think I picked the term Demon Core because it represented something small, but powerful (as opposed to randomly killing physicists) … either way, I didn’t think I’d be accepted and I’d eventually have to go with something uninspiring like ‘RMChappleProject’. Bizarrely, they went with it ... presumably they were as bored of seeing dutiful but dull names used on every project.
When I thought about creating a data visualisation themed blog I wanted to call it something similarly unusual, interesting, and easy to remember … and all my first choices of linking alternative names for geeks to either ‘data’ or ‘Viz’ were taken or sounded creepy … so demonCoreData it was!
Given the range of
choices from XKCD’s Scary Names, it could as easily have come out as Soil
Liquefaction … so, there’s something to be grateful for …
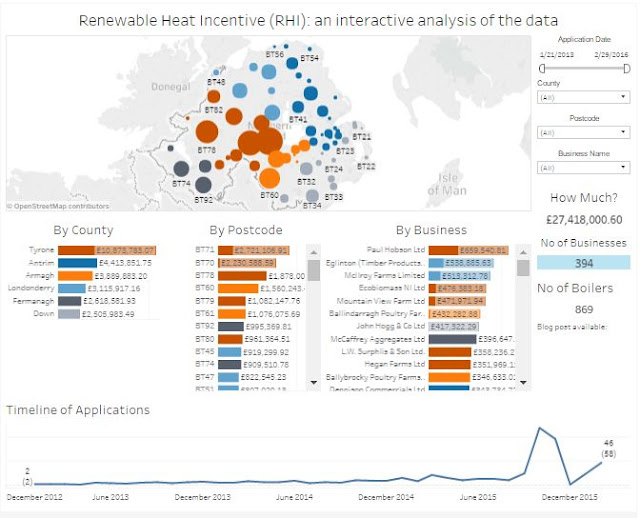
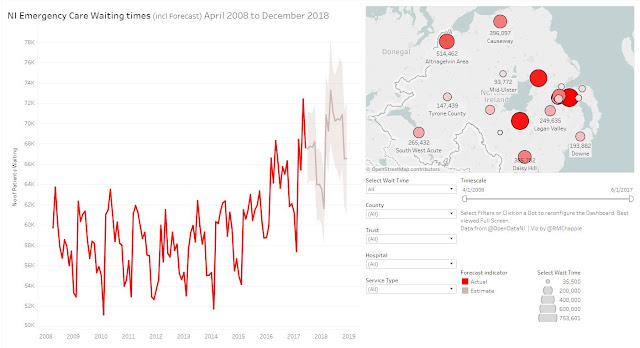
In the meantime, my Tableau Public page is here. Go take a look!
 |
| Scary Names © Randall Munroe XKCD. Used under Creative Commons licence. |
* I could no longer take working in an industry where the only available economic model was to see how quickly we could race to the bottom, so I told them where their job could be shoved ... with great force ...

Comments
Post a Comment